
Most people check the XRP price and stop there — up or down, that's the whole story. But if you actually sit with the numbers this week, there's a more interesting picture underneath the headline figure. The price is flat. Almost everything feeding into that price isn't.
The Network Itself Is Quietly Doing Its Job
It's easy to forget, in the middle of a price conversation, that XRP is attached to an actual working ledger. Transactions settle in 3 to 5 seconds. Fees run in fractions of a cent — the kind of cost structure that makes sense for cross-border payments and remittances, which is the use case this network was originally built around. None of that changed this week. It rarely does. But it's worth remembering that the token's utility case hasn't moved even while the price has been bouncing around.
That stability matters more than it sounds like it should, because a lot of the current price debate isn't really about the network — it's about everything happening around it.
Futures Traders Are Suddenly a Lot More Active
Here's a detail that hasn't gotten much attention: XRP futures just posted their biggest monthly trading volume in six months. That's a meaningful jump in activity, and it usually means one of two things — either traders are positioning for a big move, or they're hedging because they're unsure which direction that move goes. Given how flat spot prices have been, the second explanation feels more likely right now.
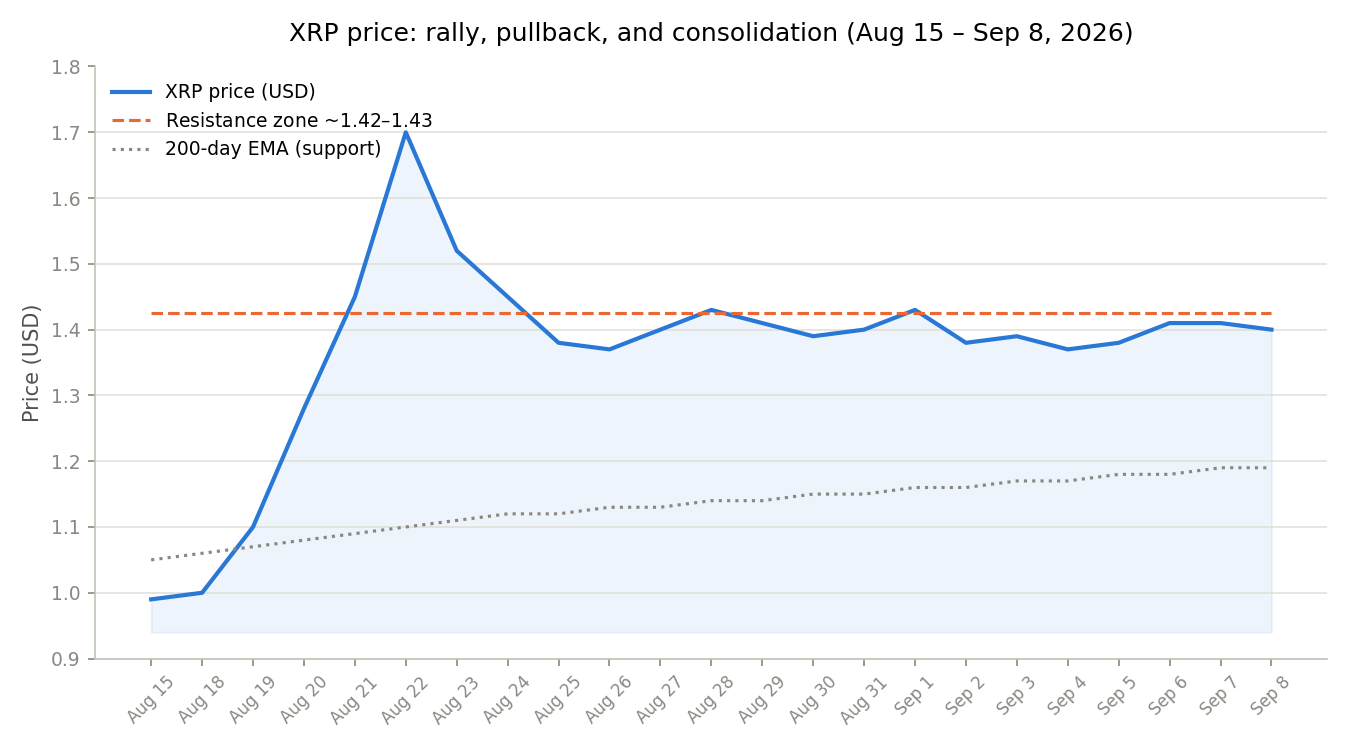
At the same time, technical charts show XRP successfully defending its 200-day exponential moving average — a longer-term support level that traders watch closely. Holding above it doesn't guarantee anything, but losing it usually triggers faster selling. So far, that hasn't happened.
ETF Money Hasn't Actually Left
This is where the story gets a little more nuanced than "money is leaving XRP." Ripple-linked ETFs just recorded their eighth consecutive week of positive inflows. Eight weeks in a row is not a small streak — it suggests that even with prices stalling out, longer-term institutional positioning hasn't reversed.
That said, some analysts are flagging downside risk if broader market signals stay mixed, and there's growing concern that a Federal Reserve rate hike could weigh on XRP specifically, since higher rates tend to pull money out of higher-risk assets across the board. Two things can be true at once here: institutions are still buying, and the macro backdrop is getting less friendly.
Where the Real Test Sits
If there's one number worth watching over the next couple of weeks, it's the level between $1.42 and roughly $2.13 — a wide corridor that's basically split between a stubborn short-term resistance wall and a longer-term upside target that some analysts have floated if spot trading volume keeps climbing the way it has recently. One recent projection specifically pointed to $2.13 as a level worth watching if volume trends hold, a target Coinpedia's XRP price prediction coverage has highlighted as part of its broader outlook for the token.
That's obviously a big spread, and getting from one end to the other would take a real shift in momentum — not just a good week. But it frames the range the market is currently negotiating.
The Bigger Question Nobody Can Fully Answer Yet
None of this — the futures volume, the ETF streak, the moving average defense — tells you which way XRP breaks first. What it does tell you is that the flat price on your screen is hiding a lot of quiet repositioning underneath it. Traders are hedging. Institutions are still accumulating. And the network keeps running exactly as designed, regardless of what any of it means for the number on the chart.
Sometimes that's the most honest thing you can say about a market: not "here's where it's going," but "here's everything happening while nobody's sure yet."