

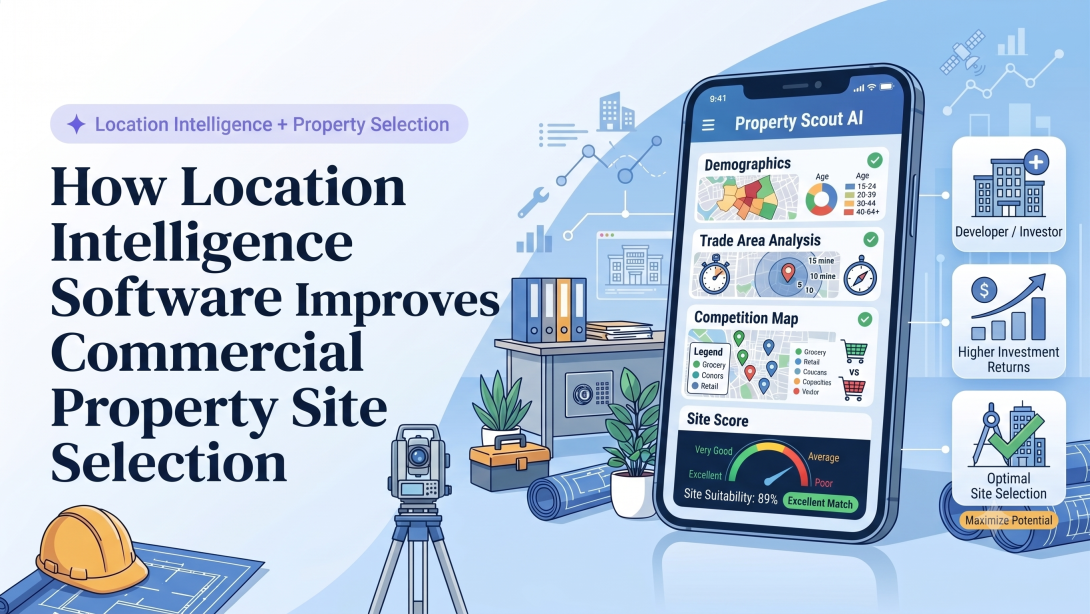
Location intelligence software is replacing the spreadsheets and gut instinct that have defined commercial real estate site selection for decades.
Traditional evaluation is slow and fragmented, pulling zoning records, demographic reports, and foot traffic counts from sources that rarely talk to each other.
Location intelligence platforms combine property, market, demographic, and mobility data into a single view, letting CRE teams compare sites in hours instead of weeks.
What Location Intelligence Software Analyzes
A location intelligence platform pulls together six categories of data to build a complete picture of any site, drawing on the same big data analytics foundation that turns raw signals into a usable location profile:
- Property and zoning data: Parcel boundaries, zoning classifications, and permitted use restrictions.
- Demographics and income: Population density, household income, and age distribution within the trade area.
- Foot traffic and mobility patterns: Pedestrian and vehicle movement data drawn from mobile location signals.
- Competitor locations: Existing competitor footprints and their proximity to a candidate site.
- Accessibility and infrastructure: Road networks, public transit access, and parking availability.
- Local development and economic trends: Planned construction, permit activity, and local economic indicators.
None of these six categories tells the full story on its own. A trade area with high incomes but poor accessibility, or heavy foot traffic but saturated competition, can look attractive on a single metric and still underperform.
Location intelligence software layers all six data sets on the same map so analysts can spot conflicts and trade-offs before they become a costly acquisition mistake.
AI-Powered Property Scoring
AI-powered scoring turns those six data categories into a single, comparable number for every candidate property. The process starts with business-specific site selection criteria, whether that is minimum household income, distance to competitors, or population density within a set radius. Location intelligence software lets teams weight each factor according to what matters most for their business model, then generates a suitability score for every property under consideration.
Scored properties are automatically ranked and shortlisted, replacing the manual comparison spreadsheets analysts once built by hand. Because criteria change as investment priorities shift, the underlying decision intelligence software recalculates scores whenever weighting changes, without requiring analysts to rebuild the model from scratch.
A grocery retailer, for example, might weight population density and drive-time access above everything else, while a specialty fitness brand weights household income and competitor gaps more heavily. The scoring model makes those priorities explicit and consistent across every analyst, rather than left to individual judgment calls that vary from one site review to the next.
Trade Area and Catchment Analysis
Catchment analysis defines the customer base a site can realistically serve, typically expressed as 5, 10, and 15-minute drive-time bands around a candidate location. Location intelligence software calculates the population within each band, along with its income and demographic distribution, giving analysts a clear read on whether a site's surrounding population matches the target customer profile.
The same drive-time modeling identifies underserved markets where demand exists but coverage does not, and flags overlap between a proposed site and an existing property in the same portfolio.
Detecting that cannibalization before acquisition prevents a new location from simply redistributing sales rather than generating incremental revenue. A real estate software development partner can help wire this catchment modeling directly into an existing site selection workflow.
Catchment data also carries forward into ongoing portfolio management, not just the initial acquisition decision. As population and income figures shift within a trade area, the same modeling flags when a previously strong site is drifting outside its original target profile, giving asset managers an early signal well before performance numbers confirm it.
Competitor & Market Gap Analysis
Competitor and market gap analysis maps the density of existing competitor locations against the trade area data already gathered, surfacing where a market is saturated and where geographic white space remains. Rather than relying on a manual drive-around survey, location intelligence software plots every competitor location on the same map used for catchment analysis, so gaps and overlaps are visible at a glance.
Proximity analysis goes a step further, estimating how much customer overlap a new site would create with nearby competitors based on drive time and demographic similarity. That estimate helps CRE teams decide whether a market has room for another location or whether expansion elsewhere would carry less cannibalization risk.
White space identification works in both directions. It highlights underserved trade areas worth pursuing, and it flags markets where a brand's own locations already sit close enough together that a new site would primarily cannibalize existing sales rather than capture new demand.
Predictive Site Performance With AI
Predictive models combine historical performance data from existing properties with the location data collected for a candidate site to forecast demand and revenue potential before a lease is signed. Machine learning models trained on this history learn which combinations of demographics, traffic patterns, and competitor proximity actually correlate with strong performance, rather than relying on rules of thumb.
The same models incorporate projected population growth and planned development to assess how a site's fundamentals might shift over a lease term, not just how they look today. That forward-looking view, covered in more depth in this breakdown of real estate technology trends, gives investment committees a defensible basis for assessing risk before committing capital.
Because the forecasts are grounded in comparable historical properties rather than a single analyst's assumptions, they hold up better under scrutiny during investment committee review. A property with a strong location score but a weak revenue forecast, or vice versa, prompts a closer look rather than getting waved through on gut feel.
Scenario Modeling for CRE Decisions
Scenario modeling lets CRE teams test what-if conditions before acquisition rather than discovering them after signing a lease. Analysts can model a competitor opening nearby, a shift in local population, or a planned infrastructure change, then see how each scenario moves a property's projected performance and suitability score.
Because every candidate site runs through the same underlying data and assumptions, teams can compare multiple properties side by side under identical conditions, removing the inconsistency that creeps in when different analysts build separate spreadsheet models with different assumptions baked in.
This matters most in competitive bid situations, where an investment committee is weighing several properties at once and needs a fast, apples-to-apples comparison. Scenario outputs can be pulled directly into the same shortlist and scoring view used earlier in the process, rather than living in a separate one-off analysis.
Building an AI-Powered Location Intelligence Platform
An enterprise-grade location intelligence platform is assembled from several connected layers, each responsible for a distinct part of the site selection pipeline:
- Geospatial database and GIS layer: Stores and renders property, boundary, and demographic data on a map.
- Data ingestion and external APIs: Pull in third-party demographic, mobility, and competitor data feeds.
- AI/ML prediction engine: Forecasts demand, revenue, and site performance from historical and location data.
- Property scoring engine: Applies weighted criteria to generate suitability scores for every candidate site.
- Interactive maps and dashboards: Visualize scores, catchments, and competitor density for analysts.
- CRE system and CRM/ERP integrations: Connect scoring output to existing deal pipelines and reporting tools.
The ingestion layer typically leans on intelligent data processing solutions to normalize demographic, mobility, and competitor feeds from multiple vendors into one consistent schema.
Measuring ROI
Location intelligence software pays for itself primarily through analyst time and better decisions, both of which are measurable once the platform is in place:
- Reduced site evaluation time: Cuts the weeks once spent gathering data down to hours.
- Increased properties screened per analyst: Lets a single analyst evaluate more candidate sites in the same timeframe.
- Improved location forecasting accuracy: Produces demand and revenue forecasts that hold up against actual results.
- Reduced acquisition risk: Surfaces cannibalization and market saturation before capital is committed.
- Tracked actual vs. predicted performance: Closes the loop between forecasted and realized site performance over time.
As adoption grows across the industry, tracked against the broader PropTech market growth trend, ROI measurement itself is becoming a standard part of the site selection process rather than an afterthought.
Conclusion
Location intelligence software gives CRE teams a faster, more defensible way to evaluate commercial property sites, replacing fragmented spreadsheets with a single scored, mapped view of every candidate location.
From property scoring through scenario modeling, the technology turns site selection into a repeatable, data-backed process rather than a guessing game.
Companies that adopt it now will screen more sites, with more confidence, and close deals faster than those still relying on manual evaluation and disconnected spreadsheets.